Shantha Kumar T
Exploring Microsoft Graph API- List all Microsoft 365 Groups
If you want to show Microsoft 365 groups anywhere with less code. Here' s blog and I would like to show you how to do this.
If you want to show Microsoft 365 groups anywhere with less code. Here’ s blog and I would like to show you how to do this.
We can easily achieve this with the help of Microsoft Graph API and Microsoft graph Toolkit. To show all the groups in a table format, we can use mgt-get component and call the groups endpoint from Microsoft Graph API.
OUTPUT:
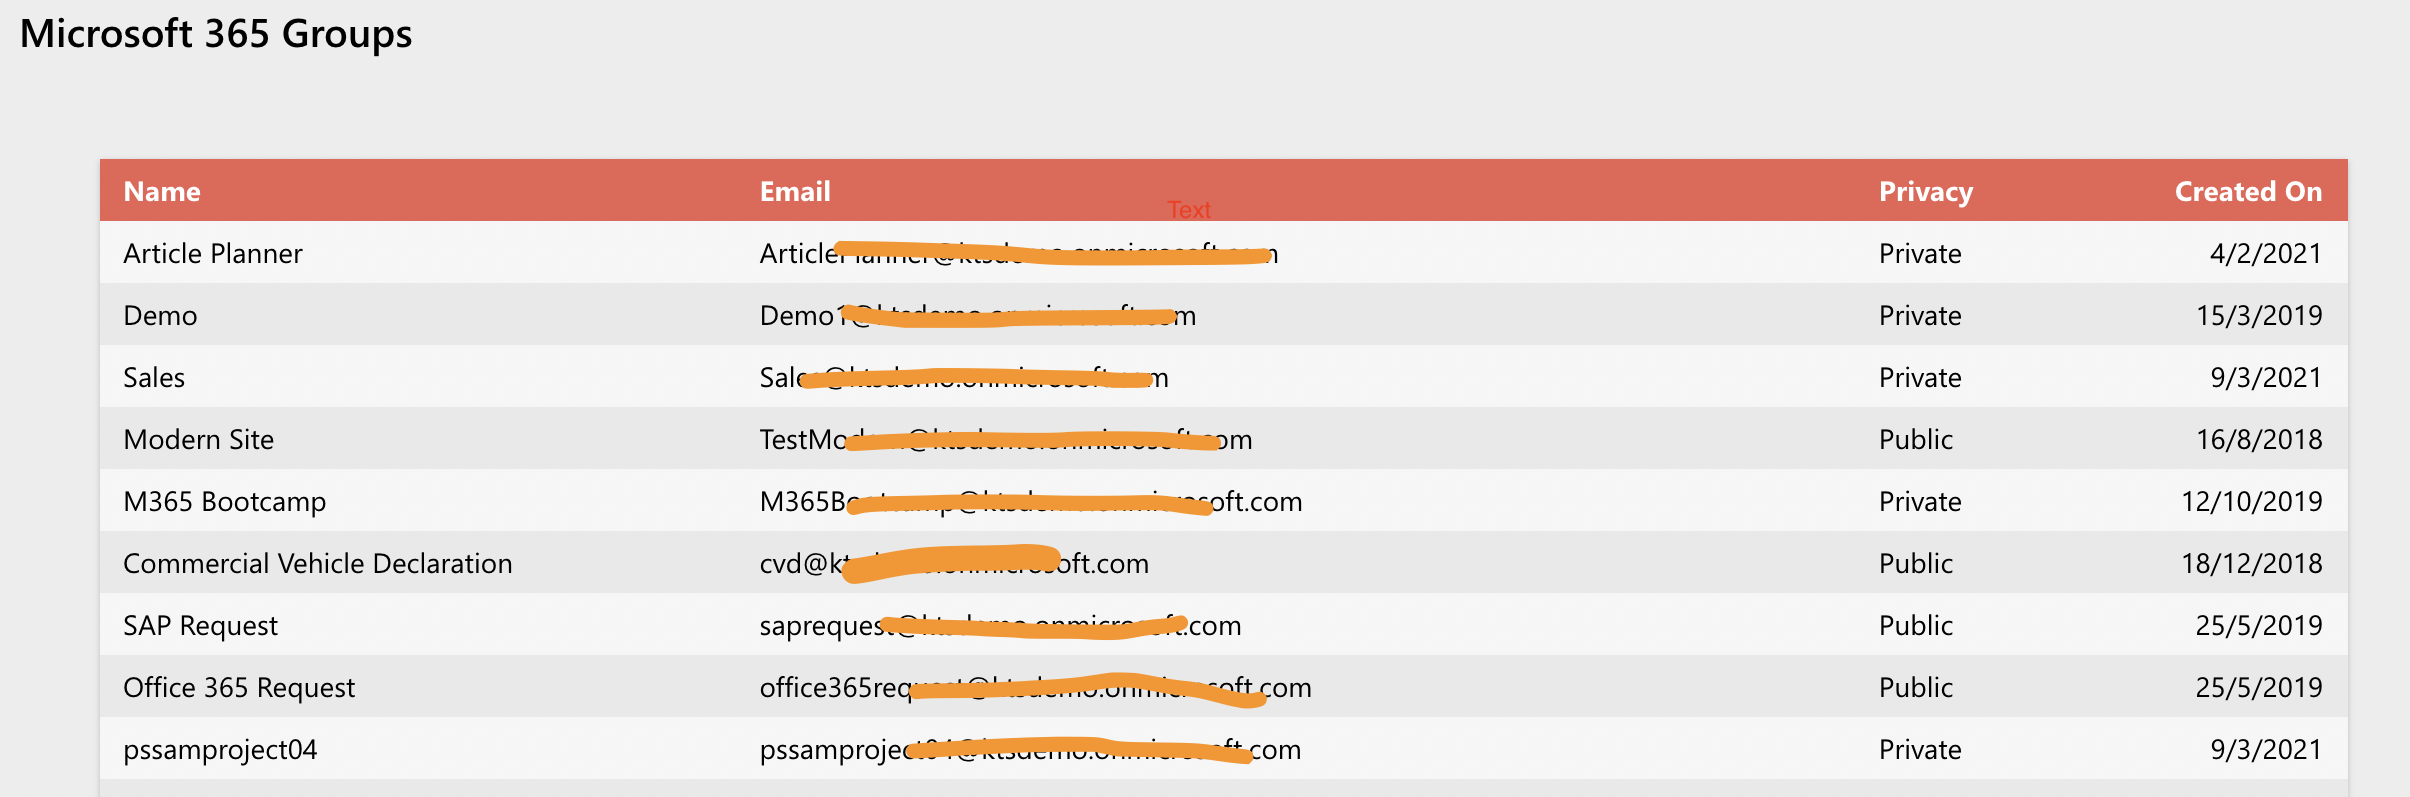
Try the below snippets in Microsoft Graph Toolkit playground or use the Microsoft Graph Toolkit Editor SPFx webpart in SharePoint.
To get the above output, add the below snippets to HTML, CSS and Javascript.
HTML Code:
Use mgt-get to retrieve the groups response and renders it based on the html code within template tag.
[code lang=”html”]
<mgt-get resource="/groups" version="v1.0" scopes="group.read" max-pages="2">
<template>
<div class="get-wrapper">
<div class="table">
<div class="row header">
<div class="cell">
Name
</div>
<div class="cell">
Email
</div>
<div class="cell">
Privacy
</div>
<div class="cell" style="text-align:right">
Created On
</div>
</div>
<div class="row" data-for="grp in value">
<div class="cell" data-title="Name">
{{grp.displayName}}
</div>
<div class="cell" data-title="Email">
{{grp.mail}}
</div>
<div class="cell" data-title="Privacy">
{{grp.visibility}}
</div>
<div class="cell" data-title="CreatedOn" style="text-align:right">
{{grp.createdDateTime}}
</div>
</div>
</div>
</div>
</template>
<template data-type="loading">
loading
</template>
<template data-type="error">
{{ this }}
</template>
</mgt-get>
[/code]
CSS Code:
Apply the styles to the template by using below css snippet,
[code lang=”css”]
.get-wrapper {
margin: 0 auto;
padding: 40px;
}
.get-wrapper .table {
margin: 0 0 40px 0;
width: 100%;
box-shadow: 0 1px 3px rgba(0, 0, 0, 0.2);
display: table;
}
@media screen and (max-width: 580px) {
.get-wrapper .table {
display: block;
}
}
.get-wrapper .row {
display: table-row;
background: #f6f6f6;
}
.get-wrapper .row:nth-of-type(odd) {
background: #e9e9e9;
}
.get-wrapper .row.header {
font-weight: 900;
color: #ffffff;
background: #ea6153;
}
@media screen and (max-width: 580px) {
.get-wrapper .row {
padding: 14px 0 7px;
display: block;
}
.get-wrapper .row.header {
padding: 0;
height: 6px;
}
.get-wrapper .row.header .cell {
display: none;
}
.get-wrapper .row .cell {
margin-bottom: 10px;
}
.get-wrapper .row .cell:before {
margin-bottom: 3px;
content: attr(data-title);
min-width: 98px;
font-size: 10px;
line-height: 10px;
font-weight: bold;
text-transform: uppercase;
color: #969696;
display: block;
}
}
.get-wrapper .cell {
padding: 6px 12px;
display: table-cell;
}
@media screen and (max-width: 580px) {
.get-wrapper .cell {
padding: 2px 16px;
display: block;
}
}
[/code]
JavaScript Code:
We can also use some javascript as a utility function to format the CreatedOn date. Replace the line for created on with
{{converttime(grp.createdDateTime)}} . Then add the below javascript function to the code,
[code lang=”js”]
function converttime(ft) {
var dt = new Date(ft);
return dt.getDate() + "/" + (dt.getMonth() + 1) + "/" + dt.getFullYear();
}
[/code]
The same as above, we can simulate of lot of presentation with the help of template in Microsoft Graph Toolkits.


Is the MS Graph is a generic service and not just limited to office 365?
Microsoft Graph API is a generic service, which helps to fetch the data across Microsoft cloud-based products.
That includes Microsoft 365, Windows 10, and Enterprise Mobility + Security applications.
Retrieving On-Premise data using Graph API is also in progress. In future, we can also retrieve the hybrid data using MS Graph API.